Beren Brande
Project 4: 2015-2018 MLB Clustering Analysis
Introduction to the Problem and the Dataset
In this project, I will be working on the previously used datasets I have used for Projects 1, 2, and 3, which are the statistics of the MLB for the 2015 - 2018 seasons, I will be using the at-bats and game file for this project. This project involves using different means of clustering on past MLB seasons. I plan to use clustering techniques to identify the correlation between the number of strikeouts for a team that wins based on the other attributes in the dataset. Such as the away team's final score, the home team's final score, the number of pitches a pitcher threw, and whether or not the pitcher pitched left-handed or right-handed.
From the at-bats & games file here are the features I believe are the most relevant:
- g_id (lets me connect the two files)
- event (lets me know if the result of the at-bat was a strikeout or not)
- top (lets me know which team was pitching at the time)
- away_final_score (lets me know the away teams final score)
- away_team (lets me know the away teams name)
- home_final_score (lets me know the home teams final score)
- home_team (lets me know the home teams name)
What is Clustering and how does it work?
Clustering is the process of dividing a dataset's data points into groups that contain other similar data points and vice versa for the other data points. To sum up it is groups that are similar vs groups that are dissimilar. K-means clustering is one of the simplest unsupervised machine learning algorithms. It is an iterative process that assigns each data point to a group and slowly but surely the data points are clustered into groups with similar features. Its main objective is to minimize the sum of the distance between the data points and the cluster centroid to correctly group each data point to where it belongs.

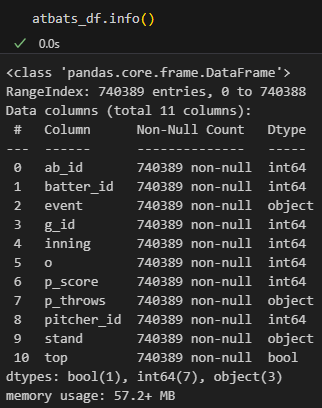
Data Understanding
To better understand the data, I started by exploring the dataset. This included loading the data looking at both of the file structures and using .head(), .info(), and .describe() to learn more about the data types of each feature.


Pre-Processing
To prep the data I decided to get rid of all the unwanted features between the two files. Then after that, I examined the files and used .head()
I then decided to combine these two files into one to make this whole process easier. And they lined up perfectly because of the g_id feature was the matching feature to link the two files into one.


Visualization
To visualize the data, I created a graph to show the amount of plays that either ended in something other than a strikeout or a play that ended in a strikeout. Understanding the distribution of strikeouts to non-strikeouts is important in understanding the modeling portion of this dataset.

Modeling
I will be using K-means clustering for modeling this dataset. To start I used the elbow method. Which is done by going through a range of values over and over again, and plotting variance to find the "elbow" points. And the graph showed me that the best k value to use is 2, based on strikeout or non-strikeout.
After figuring out the optimal k value, I created a K-means clustering model and applied it to the dataset, so it could predict the clusters and label them appropriately.


Storytelling
The dataset I have analyzed has provided a lot of insight into how strikeouts affect teams' winning percentages. The analysis has shown that the teams with more strikeouts tend to have a higher winning percentage.
Impact
Based on my results it's quite easy to gauge how much of an impact this can have on teams winning percentages. I'd say the positives would be that the predicted percentages of strikeout to wins ratio would help predict the which games they would win, and the negatives could be that the predicted percentages of strikeout to wins ratio could lead to teams relying too heavily on the predictions and end up falling short in real-time.